
Modeling Air Quality
Land use type and the associated surface characteristics (e.g., albedo, surface roughness, soil moisture, fractional vegetative cover) exert a significant influence on the near-surface meteorology. Consequently, the impacts of these properties on air quality simulations can be substantial. Most atmospheric models have traditionally employed the 24-category, 1 km USGS land use dataset. Seasonal or monthly values for land surface parameters are typically defined within meteorological and air quality models as a function of land use type.
The goal of this project is to demonstrate the feasibility and to broaden the use of remotely-sensed observations as an input to an Air Quality Modeling Decision Support System (AQMDSS) as well as for more robust performance evaluation. To this end, we are implementing within the AQMDSS a new, high-resolution (30m) land use data set (National Land Cover Dataset, NLCD-2001) as well as MODIS Leaf Area Index (LAI) and surface emissivity as inputs. These data sets represent improved spatial and temporal coverage and more accurate physical state of the land surface relative to the existing AQMDSS configuration.
Project Elements
- Conduct modeling simulations using USGS and NLCD land use data for 2006 over a 36-km CONUS grid, followed by 12 km and 4 km modeling over Phoenix, Baltimore-Washington and Houston. This allows examination of the impacts that land use characterization has on meteorology and air quality.
- Modify EPAs Atmospheric Model Evaluation Tool (AMET) to enable use of MODIS cloud cover and land surface temperature (LST) for model evaluation.
- Predict changes in land use due to urbanization and quantify impacts on meteorology and air quality.
Project Outcomes
Expected outcomes of this project include:
- An improved air quality modeling system
- Evaluation of the importance of high-resolution land use and surface properties for air quality forecasting
- A more versatile model evaluation tool
- Assessments of future air quality for 3 cities


Figure 1. Land use/land cover (LULC) classifications on a 4 km grid for the Atlanta area from USGS (top) and combined NLCD and a regional Atlanta data set, LandPro99 (bottom).
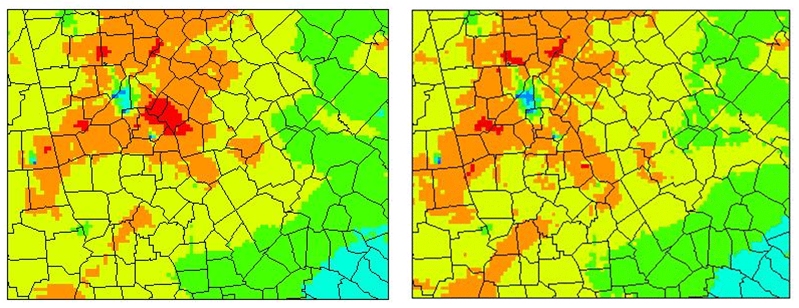
Figure 2. Air quality impact of land use data. Daily mean ozone simulated by CMAQ for the Atlanta area using NLCD (left) and USGS land use (right).

Figure 3. Land use classification for the metropolitan Atlanta area in 1999 (top) projected to 2030 using the Prescott College Spatial Growth Model (bottom).