
Energy Management in a Changing Climate
Electricity demand is highly dependent on weather, and for long-range utility resource planning it is vital to understand natural variability (on all time scales) as well as local effects related to global climate change. We have examined local temperature trends and energy consumption and production cost data for Orlando, Florida in order to evaluate the weather-energy relationships and speculate on future energy demands assuming continued temperature increases.
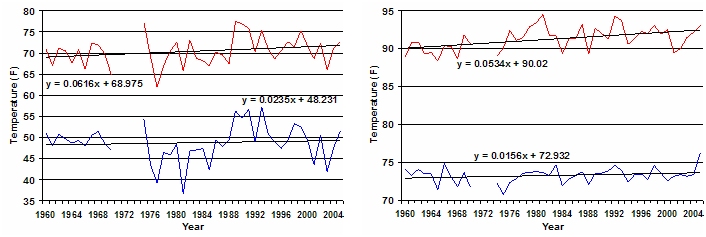
Fig. 1. Monthly mean minimum and maximum temperatures for January and July for Orlando, 1960-2005. Trend lines all shown increasing temperatures (see Table 1 for means and trends).
Monte Carlo approach was applied to simulate future Orlando climate and estimate summertime energy consumption and cost:
- Based on 1960-2005 data, normal daily maximum and minimum temperatures were projected for 2055 (Table 1).
- Given July normal temperatures for 2006 and projected for 2055, temperatures for an ensemble of 50 summers (92 days each) were generated for current (2006) and future (2055) climates.
- A daily autocorrelation coefficient of 0.46 was used, determined by analysis of 1960 2005 July daily temperatures.
- Standard deviation of 2055 simulated monthly mean temperatures was forced to equal the observed 1960-2005 variance.
- Each ensemble member (i.e. each simulated future summer) is independent.
- The 1960-2005 temperatures trends will continue until 2055
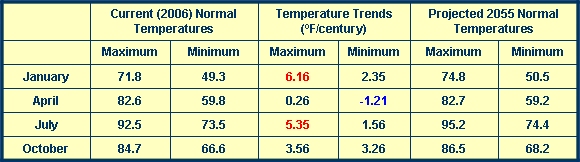
Table 1. Current (2006) normal maximum and minimum temperatures, trends and projected future (2055) values for Orlando based on data from 1960-2005. Values in red are greater than 5o F/century; values in blue are negative. Trends may reflect changes associated with large-scale greenhouse-gas warming as well as local effects due to land use change.
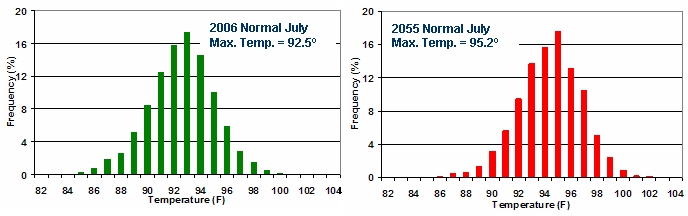
Fig. 2. Histograms of 2006 and 2055 Monte Carlo-simulated daily maximum July temperatures. The mean temperature is predicted to increase by 2.7° F, and the likelihood of very high temperatures (> 100° F) increases substantially, from virtually zero to ~ 4% of days.
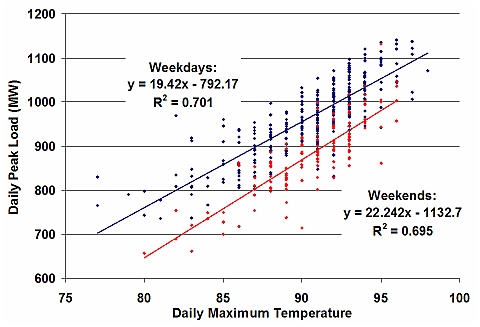
Fig. 3. Relationship between daily peak energy load and maximum temperature, based on 1960-2005 data from the energy provider OUC. These relationships, along with similar ones for daily minimum loads, were used to determine daily peak loads and daily energy consumption for all current and future simulations. Population increases are not considered.
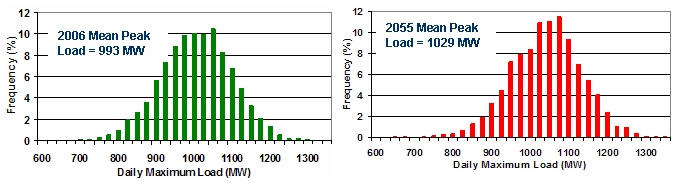
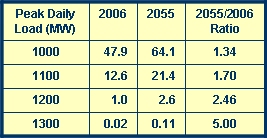
Table 2. Percentage of days with peak daily loads above given values for 2006 and 2055 simulated climates. The highest peak daily loads become much more likely by 2055.

Fig. 5. Marginal and average costs ($ per MWH) as a function of load (MW) based on 2005 data from OUC
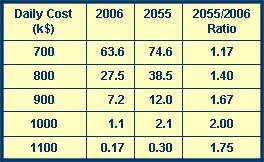
Table 3. Percent of days with daily costs above given values for 2006 and 2055 simulated climates

Fig. 6. Histograms of daily production costs for 2006 and 2055 simulated climates. There is an approximate 5% increase in per capita, current dollar cost in the 2055 climate relative to 2006.
- Orlando mean July daily maximum temperatures are increasing at a rate of over 5° F per century.
- July daily minima are increasing at a rate of about 1.5° F per century.
- As a result of this warming, summer daily peak loads are projected to increase by ~4% by 2055, not accounting for population changes.
- Abnormally high peak daily loads (>1200 MW) and daily production costs (>$1M) will occur 2.5 times as often in the 2055 climate.
- Energy production costs on a per capita, current dollar basis are projected to increase by 5% by 2055, assuming a constant cost structure, i.e. no changes in the mix of energy generation types.