Radar depolarization proves to be a good precursor to predicting infrequent lightning
On October 13th, 2022 at 0000 UTC, a line of storms swept over North Alabama, producing gusty winds but fewer lightning flashes than one might expect. Infrequent lightning poses a challenge to forecasters, and can be a significant threat to the public due to people remaining outdoors without the normal tell-tale signs of approaching lightning (such as the rumble of thunder and flash of other lightning beforehand). Lightning Researchers at NASA SPoRT aim to close that forecast gap by providing better tools for forecasters to anticipate lightning.
Figure 1 below shows the National Weather Service (NWS) Hyptop, Alabama radar depicting this line of storms oriented northeast to southwest with storms extending from near Chattanooga TN to the MS/AL state line. At the tail end of the line, a supercell thunderstorm with a large convective core formed near Hamilton, Alabama, as indicated by the high radar reflectivity dBZ values (magenta color). The dBZ scale highlights the amount of water and/or ice particles in the atmosphere. The higher the dBZ value, the greater the likelihood of high impact weather (including lightning) occurring at or near that location. Approximately 50 miles northeast of the supercell, between Russellville and Florence AL, light rain was falling indicated by the lighter green color. Generally, lower radar reflectivity regions are not synonymous with generating large lightning flashes, but this was not the case with what transpired on October 13th at 0000 UTC.
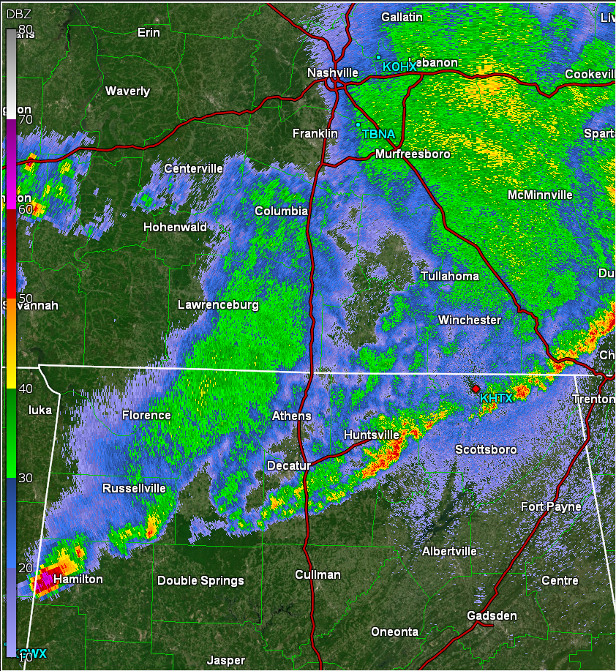
Figure 1. NWS Hytop, Alabama radar showing a base reflectivity scan on October 13th, 2022 at 0000 UTC.
Shortly after the radar scan indicated light rain northeast of Russellville, Alabama, the Geostationary Lightning Mapper (GLM) Flash Extent Density product detected large, bright but less frequent lightning flashes within the same area as shown in Figure 2.
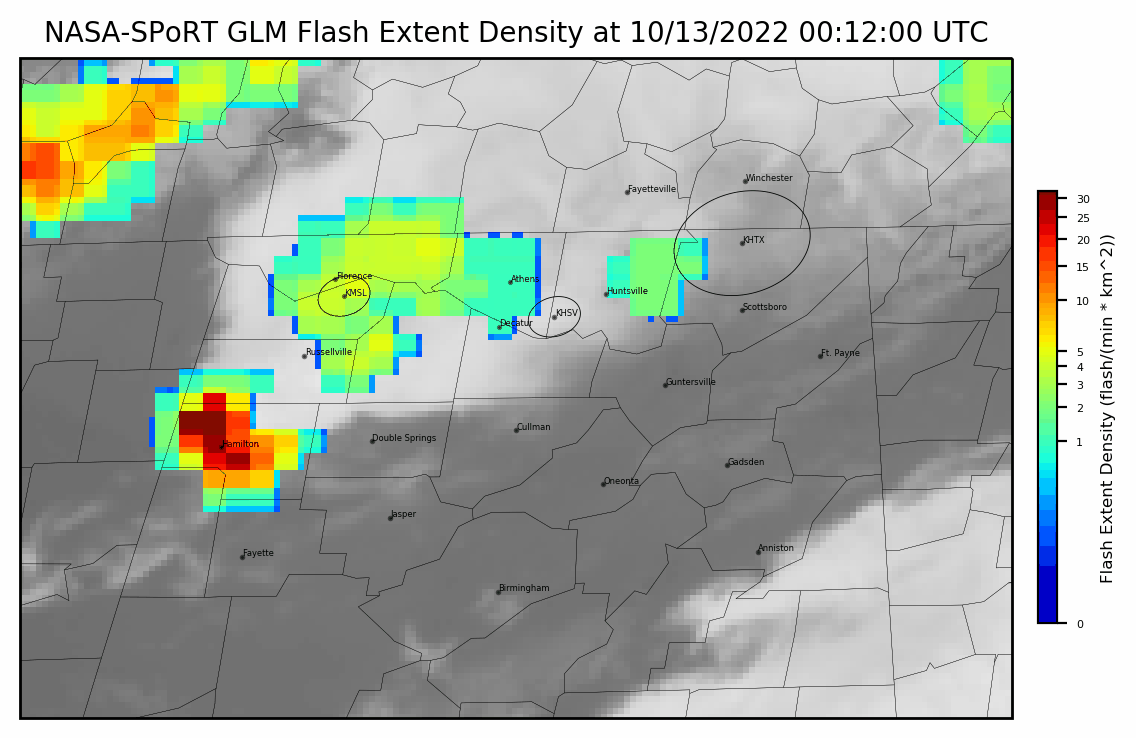
Figure 2 NASA-SPoRT GLM Flash Extent Density 30 minute time-lapse at 0000 UTC September 13th, 2022 showing large, bright flashes of lightning occurring northeast of the supercell Hamilton, Alabama indicated by the yellow color.
So how did lightning flashes occur 50+ miles away from the supercell? The supercell’s anvil spread from Hamilton, Alabama to well northeast of Russellville, Alabama. The anvil is the flat, top portion of the thunderstorm cloud. Lightning flashes generated in the convective core of a supercell can expand out through the anvil of a storm, often traveling tens or even a hundred miles or more away from the storm.
“When you have lightning expanding out from the core into the anvil of a storm, electricity is generated and electrifies ice crystals within the anvils,” says Dr. Christopher Schultz, the lead lightning research scientist at NASA SPoRT.
This means there could still be the threat of lightning after the main core of the storm has moved through an area, or even well-ahead of the storm, as is the case of “bolts from the blue.” Lightning flashes that occur within the anvil are less frequent, and thus harder to predict. Therefore, the danger of infrequent lightning becomes an issue of safety for the general public. Thankfully researchers are finding better ways to anticipate infrequent lightning.
“We can use radar depolarization to identify when the ice crystals are electrified,” says Schultz.
In radar depolarization, there is a differential reflectivity scan which uses vertical and horizontal beams that capture the size and shape of ice crystals. The electrified ice crystals show up as streaks on the scans.
Sebastian Harkema, a University of Alabama in Huntsville PhD candidate working with SPoRT, and Schultz have been studying these streaks within winter storms to determine lightning potential. Their research was published in the Advancing Earth and Space Science Journal titled “Remote Sensing of Electric Fields Observed Within Winter Precipitation During the 2020 Investigation of Microphysics and Precipitation for Atlantic Coast-Threatening Snowstorms (IMPACTS) Field Campaign”. During winter storms that occurred in 2020, Harkema observed conditions were ideal for lightning potential.
“There were two aircrafts. One flight measured the electric field above winter storms and another flight measured liquid water and ice habits within the storms. The results of the flights captured signals of electric activation. This means the streaks captured by differential reflectivity from radars are not just anomalous. We now have the physical data that indicate the ingredients we need for electrification are present in these streaks,” says Harkema.
These streaks observed within winter storms can also be applied to convective storms year-round. From the line of storms in North Alabama on October 13th, 2022 at 0000 UTC, Schultz and Harkema observed multiple streaks from the differential reflectivity scan northeast of Russellville, Alabama highlighted by the red circle in Figure 3.

Figure 3 highlights the National Weather Service’s Hytop, Alabama radar differential reflectivity scan showing two streaks of electrified ice crystals, indicated by the dark purple color within the red circle.
Within 30 minutes of the observed streak, the GLM Flash Extent Density product picked up large, bright lightning flashes that occurred northeast of Russellville, Alabama seen by the yellow color in Figure 2.
“Generally, by examining the streaks produced by differential reflectivity, you’ll get a longer lead to predict infrequent lightning flashes,” says Schultz.
To better highlight these streaks for operational forecasters and other stakeholders in the weather community to use, Harkema is currently creating an algorithm to showcase these streaks and areas of potential electrification. Schultz and Harkema hope this future product and their research will help better predict lightning during these infrequent events and be adopted by the operational community.
About SPoRT
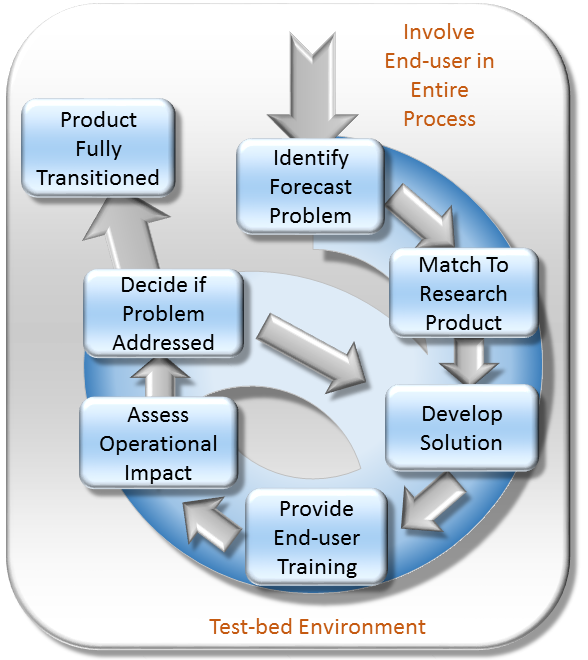
The Short-term Prediction Research and Transition (SPoRT) center at NASA's Marshall Space Flight Center in Huntsville, AL is a NASA-funded activity with a vision of accelerating the translation of NASA science to applications by collaborating with researchers, innovators, and stakeholders. SPoRT was established in 2002 and is funded under the NASA Earth Science Division Research and Analysis Program’s Weather and Atmospheric Dynamics Focus Area. Therefore, SPoRT’s early focus was on transitioning NASA products to the operational weather community to improve short-term forecasting with end users within the operational weather community (e.g. National Oceanic and Atmospheric Administration National Weather Service). Today SPoRT focuses on applied research and applications in 6 focus areas that span weather, atmospheric, and land surface topics with partnerships across government, academia, and the private sector (see Collaborative Partners). A research-to-operations/operations-to-research paradigm (figure below) has been the basis for transitioning over 40 satellite products to stakeholders over 20 years. The main goals of the SPoRT paradigm include (1) early and intentional interaction with stakeholders, (2) identifying and/or developing user-driven science solutions from NASA observations and research capabilities, (3) timely delivery of data products for early stakeholder testing and feedback, (4) integration of data products and capabilities in user formats, visualizations, and display systems, (5) targeted applications-based training highlighting use cases, examples, product advantages and limitations, (5) stakeholder assessments and product testing, and (6) prioritizing operations to research feedback to meet users’ needs and facilitate the sustained use of NASA data in applications. The SPoRT paradigm enables intentional interaction between scientists and stakeholders throughout the research-to-applications/applications-to-research lifecycle to develop innovative solutions through an iterative process that meet stakeholder needs, are tailored for their application, and promote sustained use of NASA observations and research capabilities. SPoRT values innovation, collaboration, and engagement to bridge the gap between science and applications and maximize the benefit of NASA data for operations, applications, and decision making.

Responsible Official: Dr. Andrew Molthan (andrew.molthan@nasa.gov)
Page Curator: Paul Meyer (paul.meyer@nasa.gov)
Support Disclaimer