The Rumble Heard 'Round the Valley
Hear a long rumble and several loud bangs around 06:22 pm CT last night? You weren’t alone if you were in the Tennessee Valley. While severe storms were ongoing in Southern Mississippi and Alabama, a large shield of moderate stratiform rain was parked over Northern Alabama. Most of the time things were quiet, but at 06:22 pm CT, thunder shook the entire Tennessee Valley.
Looking at the lightning data available from the Geostationary Lightning Mapper (GLM), National Lightning Detection Network (NLDN), and NASA Marshall’s Lightning Mapping Array (NALMA), we can pinpoint the extent, the origin, and the number of contributing lightning flashes to this loud rumble that lasted 7-10 seconds.
From the GLM perspective, a large swath of lightning was observed extending northward from South Central Alabama at 06:22 pm CT (Figure 1a). Using information from a real-time long flash detection algorithm from Peterson (2019), there was a series of 2 flashes that occurred within 1 second of each other. One was approximately 267 km long and propagated along the AL/MS border, while the second occupied much of Central Alabama and was approximately 253 km long. The NALMA also indicates this dual propagation path structure over West Central and Central Alabama (Figure 1b).

Figure 1 – (top, a.) GLM Flash Extent Density between 2320 and 2325 UTC on 19 April 2020. Underlaid is GOES-16 10.35 µm brightness temperature. (bottom, b.) NASA Marshall’s North Alabama Lightning Mapping Array data from 2320-2330 UTC. Blue dots indicate the path of lightning flashes during this period, with two paths going northward from the strong storms in South Alabama.
105 lightning flashes were observed in the state of Alabama between 06:22:35 pm and 06:22:39 pm CT (Figure 2a). Zooming in on the Tennessee Valley (Figure 2b), 11 NLDN points were observed in the National Weather Service County Warning area. Nine of these were positive cloud-to-ground strokes, or strokes typically characterized by strong electric fields, with peak amplitudes between 46 and 202 kA. Positive strokes make up less than 5% of all lightning strikes ( NWS ), but are well known to occur in vast stratiform regions (e.g., Makowski et al. 2013 and references therein).

Figure 2 – NLDN data between 23:22:35 UTC and 23:22:39 UTC on 19 April 2020. Left shows flashes in all of Alabama during this time, right shows a zoomed in version of the Tennessee Valley.
Indicators of electrification visible in the radar data for nearly the previous hour across West Central Alabama. In Figure 3, horizontal reflectivity is mostly uniform; however, examination of differential reflectivity (ZDR) at 1.3 degrees suggests the formation of depolarization streaks. The orientation of snow crystals in thunderstorm clouds is often altered in the presence of strong electric fields and this can produce noticeable cross-coupling between radar signals at the horizontal and vertical polarizations, when both signals are present (Ryzhkov and Zrnić 2007, Kumjian 2013). This leads to the presence of “streaks” in the ice crystals, which are visible in ZDR. Such streaks were present to the southwest and southeast of the KHTX radar at Hytop, AL, and are located above the melting layer (Fig 3b).

Figure 3 – Radar data at 2319 UTC from the NWS radar at Hytop, Alabama (KHTX). Left is horizontal reflectivity, and right is differential reflectivity at 1.3 degrees elevation. Depolarization streaks are denoted in red ovals, and the melting layer is identified by orange arrows.
At this point, it’s unclear what percentage of depolarization streaks are followed by lightning occurrence, but the depolarization streak does indicate the potential for lightning. With additional work and operational testing, the depolarization streak could be a useful for Integrated Decision Support Services such as airport weather warnings. Thus, there are potentially additional fusion techniques to develop between the radar and lightning data to anticipate and confirm lightning presence in these low flash rate situations.
References
Kumjian, M. R., 2013: Principles and applications of dual-polarization weather radar. Part III: Artifacts. J. Operational Meteor., 1 (21), 265-274, doi: http://dx.doi.org/10.15191/nwajom.2013.0121 .
Makowski, J. A., D. R. MacGorman, M. I. Biggerstaff, and W. H. Beasley, 2013: Total lightning characteristics relative to radar and satellite observations in Oklahoma Mesoscale Convective Systems. Mon. Wea. Rev. , 141 , DOI: 10.1175/MWR-D-11-00268.1
Peterson, M., (2019), Research applications for the Geostationary Lightning Mapper Operational Lightning Flash Product, J. Geophs. Res. , 17-18 , https://doi.org/10.1029/2019JD031054
Ryzhkov, A.V. and D.S. Zrnić,2007: Depolarization in Ice Crystals and Its Effect on Radar Polarimetric Measurements. J. Atmos. Oceanic Technol., 24 ,1256–1267, https://doi.org/10.1175/JTECH2034.1
About SPoRT
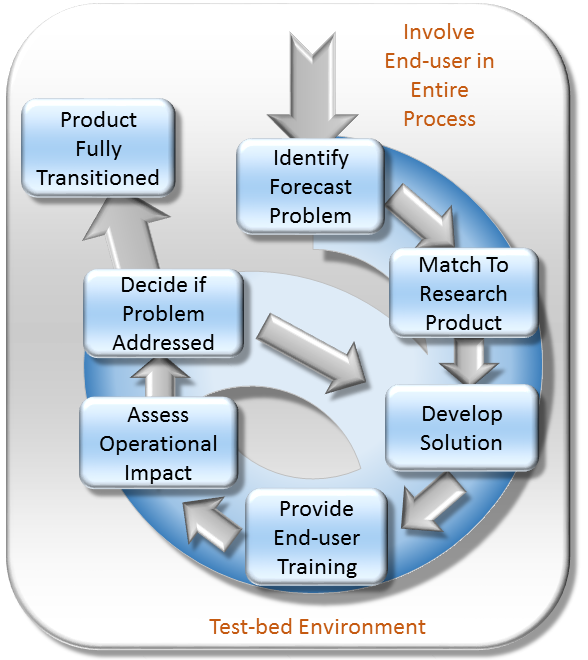
The Short-term Prediction Research and Transition (SPoRT) center at NASA's Marshall Space Flight Center in Huntsville, AL is a NASA-funded activity with a vision of accelerating the translation of NASA science to applications by collaborating with researchers, innovators, and stakeholders. SPoRT was established in 2002 and is funded under the NASA Earth Science Division Research and Analysis Program’s Weather and Atmospheric Dynamics Focus Area. Therefore, SPoRT’s early focus was on transitioning NASA products to the operational weather community to improve short-term forecasting with end users within the operational weather community (e.g. National Oceanic and Atmospheric Administration National Weather Service). Today SPoRT focuses on applied research and applications in 6 focus areas that span weather, atmospheric, and land surface topics with partnerships across government, academia, and the private sector (see Collaborative Partners). A research-to-operations/operations-to-research paradigm (figure below) has been the basis for transitioning over 40 satellite products to stakeholders over 20 years. The main goals of the SPoRT paradigm include (1) early and intentional interaction with stakeholders, (2) identifying and/or developing user-driven science solutions from NASA observations and research capabilities, (3) timely delivery of data products for early stakeholder testing and feedback, (4) integration of data products and capabilities in user formats, visualizations, and display systems, (5) targeted applications-based training highlighting use cases, examples, product advantages and limitations, (5) stakeholder assessments and product testing, and (6) prioritizing operations to research feedback to meet users’ needs and facilitate the sustained use of NASA data in applications. The SPoRT paradigm enables intentional interaction between scientists and stakeholders throughout the research-to-applications/applications-to-research lifecycle to develop innovative solutions through an iterative process that meet stakeholder needs, are tailored for their application, and promote sustained use of NASA observations and research capabilities. SPoRT values innovation, collaboration, and engagement to bridge the gap between science and applications and maximize the benefit of NASA data for operations, applications, and decision making.

Responsible Official: Dr. Andrew Molthan (andrew.molthan@nasa.gov)
Page Curator: Paul Meyer (paul.meyer@nasa.gov)
Support Disclaimer