“That Doesn’t Look Right” – Fusion of Lightning and Radar data to Understand an Odd Jump in Lightning Activity during On Air Coverage of Severe Weather
During the overnight period between March 24th and 25th 2023, severe weather, including seven tornadoes tore through parts of North Alabama and Southern Middle Tennessee. Each television station in the Huntsville market was live on air in “wall-to-wall” coverage as the severe weather swept through the area. Around 12:50 A.M., I was watching one of the local stations when suddenly, the Chief Meteorologist said: “That doesn’t look right, I don’t know why we’re getting so much lightning behind the line.”
A rapid increase in lightning, known as a lightning jump, is a good precursor to storm intensification and severe weather occurrence. The Chief Meteorologist who made this comment is well versed in lightning jumps and has readily used the concept of a lightning jump to inform viewers when storms are strengthening over the past decade during severe weather events. The Chief Meteorologist has previously applied the lightning jump concept by using the counter in their software system. The Chief Meteorologist has also zoomed in on particular storms, manually counting each “flash” from the ground-based system their software system provides for television newscasts.
Inspecting the time in which the Chief Meteorologist made this comment, which occurred between 0547 UTC (12:47 P.M. CST) and 0549 UTC (12:49 P.M. CST), 30 lightning flashes were identified by the television station’s software system well behind the main area of severe convection. In the blue shaded area at 0548 UTC in Figure 1, seven of the 30 flashes were designated as positive cloud-to-ground (+CG), three were designated as negative cloud-to-ground (-CG), and 20 of them were identified as cloud flashes (IC). Looking at the radar, the flashes all occurred in weak areas of reflectivity, where high concentrations of lightning are not normally observed.

Figure 1. The top three panels are ground based lightning detections over Northern Alabama and Southern Middle Tennessee on 25 March 2023 between 0547 and 0549 UTC. Green dots are IC flashes, red plus signs are positive CG flashes and black minus signs are negative CG flashes. The blue area indicates the region of interest from the broadcast meteorologist, where 30 lightning flashes suddenly appeared well behind the convective line. The bottom panel is reflectivity from the National Weather Service Hytop Radar (KHTX) at 0547 UTC at 0.5 degrees elevation. Tornado warnings are red polygons, while yellow polygons are severe thunderstorm warnings that were in effect at the time of the capture.
By further examining this timeframe, the lightning system the television station uses is point based. The system uses an array of ground-based sensors that wait for an electromagnetic pulse to pass by the sensor (e.g., Cummins et al. 1998). Time is recorded and when combined with other sensors in the array, the location of the lightning flash is pinpointed in space. This type of system gives the exact location, estimation of ground flash or cloud flash, its polarity, and peak current often to a high degree of accuracy. However, we know that lightning can sometimes travel long distances. The largest lightning flash on record traveled 477 miles (768 km) and lasted approximately 17 seconds (Peterson et al. 2022). This spatial extent is not captured by the sensors that feed the television station graphics, so every lightning flash appears to be independent of each other.
What can be done to mitigate these “jumps” in lightning activity from ground-based lightning systems that sometimes occur in these scenarios but are not connected to severe weather? Apply other datasets.
The first step is to review the radar scans. Reflectivity and differential reflectivity can show an increase in lightning in a region of stratiform rain, where large lightning flashes are generally observed. By observing data from KHTX on March 25th at 0547 UTC, reflectivity is barely making it to 40 dBZ (Fig. 2 left panel). Additionally, differential reflectivity above the melting layer (Fig. 2 right panel) has two depolarization streaks embedded in a broad area of negative differential reflectivity. Depolarization streaks indicate where ice crystals and aggregates are caught in the cloud’s electric field and can signal lightning potential.

Figure 2. The 0.5-degree elevation radar reflectivity (dBZ; left) and 2.4 degree elevation differential reflectivity (dB; right) from KHTX at 0547 UTC on 25 March 2023. Warning information is the same as in Figure 1.
The second step is to use another lightning observation that captures spatial extent. Since the Geostationary Lightning Mapper (GLM) is in orbit on GOES16 and GOES 18, measurements of lightning spatial footprint are now more common even if they are not readily available for television meteorologists within their software systems.
Going back to 0548 UTC with the GLM data and overlaying the ground-based lightning data, there is an extensive flash propagating rearward from the convective line. This combination of lightning datasets maximizes the strengths of the ground networks (indicating where lightning has come to ground or stayed in the cloud) with the lightning mapper (spatial extent of lightning) to connect the dots for the path the lightning took near the strong convective line rearward into the stratiform rain cloud. This behavior has been documented regularly in literature.

Figure 3. Side-by-side comparison of the ground-based lightning only at 0548 UTC (same as the top middle panel in Figure 1) and a panel with GLM overlaid on the ground-based data (right panel). Shaded boxes indicate where GLM observed lightning from space.
In summary, the oddity noted by the Chief Meteorologist during their television station’s wall-to-wall coverage was from a large lightning flash that initiated near the convective line and propagated rearward into the stratiform rain cloud; coming to ground at least 10 times. When these oddities happen, it’s imperative to check radar and other lightning sources for confirmation. As GLM data becomes more commonly used, it’s likely that these data start making it onto television like polarimetric radar slowly gained traction on once its capabilities were translated to a broadcaster framework which could be communicated to the audience.
For additional reading on lightning location systems, GLM, depolarization, and another case where this behavior has been observed, please see the links below.
Additional Reading:
Lightning location systems and how they work:
Cummins et al. 1998 - https://agupubs.onlinelibrary.wiley.com/doi/abs/10.1029/98JD00153?utm_sq=gyqacecmy8
Longest Lightning flash methodology:
Peterson et al. 2022 - https://journals.ametsoc.org/view/journals/bams/103/4/BAMS-D-21-0254.1.xml#:~:text=2020).,States%20on%2029%20April%202020.
Depolarization streaks in differential reflectivity and their tie to electrification:
Use of Depolarization and fusion of lightning datatsets to observe infrequent lightning flashes – Schultz et al. 2021 - https://journals.ametsoc.org/view/journals/wefo/36/2/WAF-D-20-0095.1.xml
Lightning jumps:
Williams et al. 1999 - https://www.weather.gov/media/mlb/research/tli_svr.pdf
Physical basis: Schultz et al. 2017 - https://journals.ametsoc.org/view/journals/wefo/32/1/waf-d-15-0175_1.xml
About SPoRT
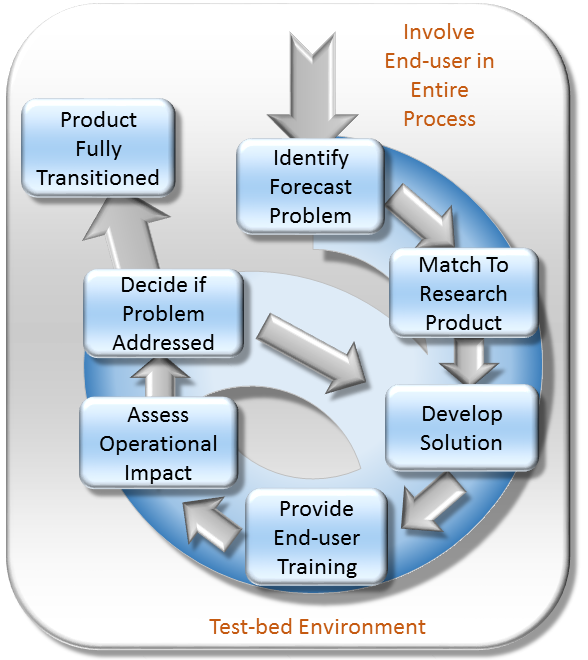
The Short-term Prediction Research and Transition (SPoRT) center at NASA's Marshall Space Flight Center in Huntsville, AL is a NASA-funded activity with a vision of accelerating the translation of NASA science to applications by collaborating with researchers, innovators, and stakeholders. SPoRT was established in 2002 and is funded under the NASA Earth Science Division Research and Analysis Program’s Weather and Atmospheric Dynamics Focus Area. Therefore, SPoRT’s early focus was on transitioning NASA products to the operational weather community to improve short-term forecasting with end users within the operational weather community (e.g. National Oceanic and Atmospheric Administration National Weather Service). Today SPoRT focuses on applied research and applications in 6 focus areas that span weather, atmospheric, and land surface topics with partnerships across government, academia, and the private sector (see Collaborative Partners). A research-to-operations/operations-to-research paradigm (figure below) has been the basis for transitioning over 40 satellite products to stakeholders over 20 years. The main goals of the SPoRT paradigm include (1) early and intentional interaction with stakeholders, (2) identifying and/or developing user-driven science solutions from NASA observations and research capabilities, (3) timely delivery of data products for early stakeholder testing and feedback, (4) integration of data products and capabilities in user formats, visualizations, and display systems, (5) targeted applications-based training highlighting use cases, examples, product advantages and limitations, (5) stakeholder assessments and product testing, and (6) prioritizing operations to research feedback to meet users’ needs and facilitate the sustained use of NASA data in applications. The SPoRT paradigm enables intentional interaction between scientists and stakeholders throughout the research-to-applications/applications-to-research lifecycle to develop innovative solutions through an iterative process that meet stakeholder needs, are tailored for their application, and promote sustained use of NASA observations and research capabilities. SPoRT values innovation, collaboration, and engagement to bridge the gap between science and applications and maximize the benefit of NASA data for operations, applications, and decision making.

Responsible Official: Dr. Andrew Molthan (andrew.molthan@nasa.gov)
Page Curator: SPoRT Support (msfc-dl-sport-support@mail.nasa.gov)
Support Disclaimer