
Michael Geigert, Senior Air Pollution Control Engineer, Bureau of Air Management
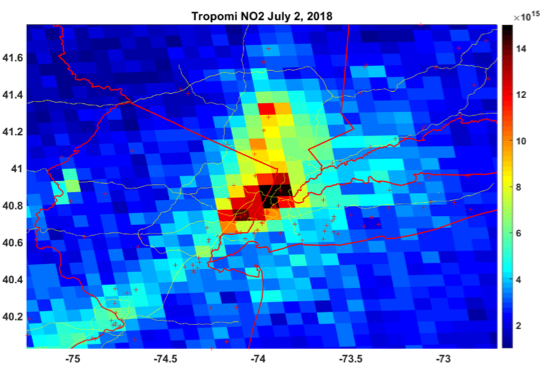
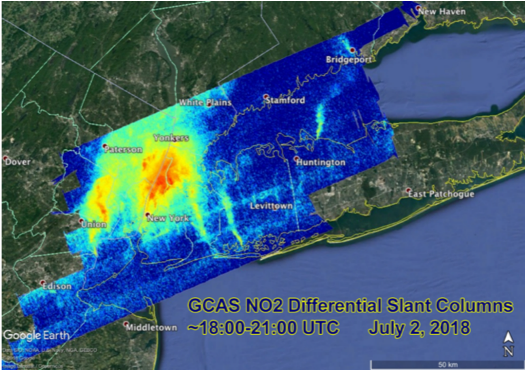
After reviewing preliminary data from the Long Island Sound Tropospheric Ozone Study 2018, it is apparent that the area around NYC emits noticeably larger amounts of NO2 on days that monitor elevated ground level ozone. The TROPOMI satellite images verify that the NYC area NO2 emissions stand out among the other major cities from Washington DC, to Boston. Higher resolution images from the NASA GCAS flights were able to pin-point specific NO2 plumes to point source electrical generating units (EGUs). Because Connecticut continues to monitor the highest ozone design values on the East Coast, it is vital that the source, strength, and timing of the ozone precursors be determined, especially during the ‘ozone season,’ which typically occurs between May 1 and September 30. Although the TEMPO spatial resolution will not match the 250 meter resolution of the GCAS images, the instrument would be able to scan more frequently (10 minute time intervals) and produce spatial resolution images greater than the nominal 2.1 km x 4.7 km pixel size. In addition to the point source EGU plumes, it would be useful to determine contributions from mobile source emissions (NO2, H2CO, and C2H2O2) along major highways and from marine vessels in shipping channels and along the land/water interface. Furthermore, with the geostationary TEMPO measurements, it would be highly informative to track NO2 emissions activity over time in the study area during daylight hours spanning multiple days of a high ozone episode.


Emissions from biomass burning can vary greatly both regionally and from event to event, but previous work has been unable to fully explain this variability. Of particular interest is the unexplained variability in ozone production from fires. The primary emissions from burning and the chemistry in fire plumes evolve on hourly and daily timescales, making observations from TEMPO especially valuable for investigating these processes. The suite of NO2, H2CO, C2H2O2, O3, H2O, and aerosol measurements from TEMPO is well suited to investigating how the chemical processing of primary fire emissions effects the secondary formation of VOCs and ozone. Ongoing efforts are working to address complications for trace gas retrievals in forest fires due to high aerosol loading. TEMPO measurements should not only increase understanding of the chemical emissions from biomass burning but also be a powerful tool for monitoring and assessing the impact of burning on human health and climate change. For particularly important fires it is possible to command special TEMPO observations at even shorter than hourly revisit time, probably as short as 10 minutes.
Randall Martin, Washington University in St. Louis, and Ken Pickering, NASA Goddard Space Flight Center
Lightning-produced NO is the major NOx source in the upper troposphere and can lead to substantial tropospheric O3 production there. Interpretation of satellite measurements of tropospheric NO2 and O3, and upper tropospheric HNO3, in association with a global chemical transport model leads to an overall estimate of 6 ± 2 Tg N y-1 from lightning. Direct analysis of satellite NO2 observations in relation to observed lightning flashes has also been conducted to estimate NOx production per flash. High time resolution TEMPO measurements, including tropospheric NO2 and O3, can be made for time periods and longitudinal bands selected to coincide with large thunderstorm activity, including outflow regions, with fairly short notice. These observations can be analyzed together with flash rates from the Geostationary Lightning Mapper onboard the GOES-16 and 17 satellites to estimate NOx production per flash. Doing so may be able to significantly better quantify lightning NOx and O3 production over Greater North America, and determine regional variability of NOx production per flash. Sophisticated analysis of NO2 and lightning measurements and coincident meteorology will be necessary due to the substantial lightning NO2 signal in cloudy scenes. High time resolution TEMPO NO2 observations will allow evaluation of NOx lifetime in the near field of deep convection. An understanding of this lifetime is critical in constraining satellite-based estimates of NOx production per flash.
Kelly Chance and John Houck, SAO
TEMPO's optimized data collection scan pattern during mornings and evenings provides multiple advantages for addressing TEMPO science questions. The increased frequency of scans coincides with peaks in vehicle miles traveled on each coast, and thus is better able to capture the variability in NOX and VOC emissions from mobile sources through measurements of NO2, H2CO, and C2H2O2. The morning and evening are also of interest for better quantifying the diurnal changes in photochemistry as there is rapid change in the number of available photons. More frequent observations of the morning atmosphere in the Eastern U.S. are of particular benefit since there is usually a rapid rise in ozone concentrations during the time period. Morning NOX and VOCs are often the primary drivers of peak ozone levels later in the day. More frequent observations lead not only to more accurate quantification of the early morning production of these ozone precursors, but also better characterization of the diurnal patterns of emissions, and better assessment and forecasting of peak ozone air quality levels. TEMPO can measure pollution development during the morning and evening rush hours at urban scales over non-coastal as well as coastal cities using special observations. TEMPO will also determine how pollution varies during the week and on weekends and determine long-term seasonal and interannual variability. TEMPO will be able to monitor pollution with the resolution to quantify emissions over major highways.

