TEMPO Synthetic Data
A key component of the Early Adopters program is the development and distribution of synthetic TEMPO level 2 data products. The goal of distributing synthetic data is to identify end user needs by enabling an early assessment of data interfaces, files, and products, in addition to characterizing the applications of the TEMPO mission. The TEMPO retrieval team is developing “fast” synthetic products by applying retrieval effects, including lookup tables and on-line radiative transfer calculations, to model profiles that have been interpolated to the TEMPO pixels across the Field of Regard (FOR). These products will be distributed to early adopter community via a file server at NASA Marshall Space Flight Center by summer 2020. A technical document describing the synthetic data files will also be provided to the early adopters. Other synthetic level 2 products generated from synthetic radiances and operational retrieval algorithms will also be distributed in the future.
| Level 2 Product | Product Variables | Support Variables | Resolution (km2) |
|---|---|---|---|
| O3 profile | VCDs for Total, Stratopsheric, Tropospheric, and 0-2km layers | Errors, a priori profile, averaging kernels | 8.0×4.75 |
| Total O3 | Total VCD | Cloud Fraction | 2.0×4.75 |
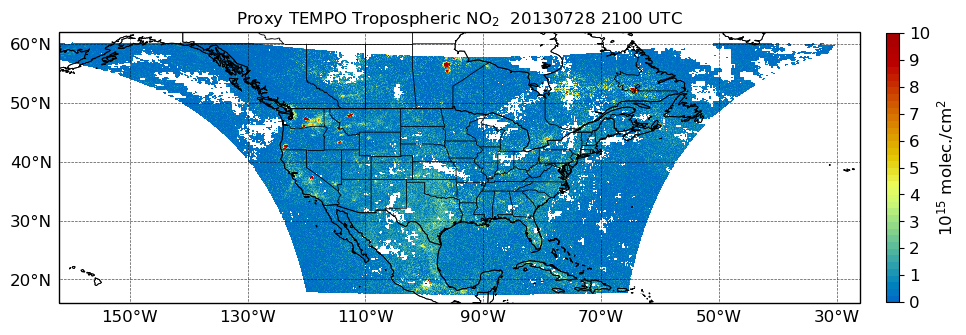
| NO2 | Stratospheric and Tropospheric VCDs | SCD, error, shape factor, scattering weights | 2.0×4.75 |
| HCHO | Tropospheric VCDs | SCD, error, shape, factor, scattering weights | 2.0×4.75 |
| C2H2O2 | 2.0×4.75 | ||
| H2O | 2.0×4.75 | ||
| BrO | 2.0×4.75 | ||
| SO2 | 2.0×4.75 | ||
| Aerosol | Absorbing Aerosol Index, Aerosol Optical Depth, Single Scatter Albedo | Errors | 8.0×4.75 |
This first phase of synthetic TEMPO data distribution will include NO2 and HCHO products. This page will be updated as new synthetic data in the baseline product list become available.
Synthetic TEMPO data can be visualized using the ArcGIS platform at the MSFC Earth Portal
Basic instructions for visualizing TEMPO data in ArcGIS
- Click the ellipses under the product name on the left side of the display, then click Image Display
- In Image Display, select ‘tropospheric_column_amount’ for Renderer, then click Apply. Users can also select own image enhancement and colorbar.
- Change default time setting at bottom of page by clicking on the two horizontal bars to the right of the time bar. Click on ‘Show Advanced Settings’. In Time Settings, ensure start and end times do not span more than a 28-day period. Under Time Display, display data in 1 Hour intervals.