Real-Time SPoRT-MODIS Vegetation Dataset
Since summer 2010, the SPoRT Center has been producing real-time, daily vegetation composites at a native 0.01° resolution over the Continental United States (CONUS) for use in the NASA Land Information System (LIS) and Weather Research and Forecasting (WRF) numerical weather prediction model (Case et al. 2011). Green vegetation fraction (GVF) is derived from direct-broadcast swaths of normalized difference vegetation index (NDVI) from the Moderate Resolution Imaging Spectroradiometer (MODIS) aboard the NASA Earth Observing System satellites. The GVF represents the fraction of a grid pixel containing photosynthetically active, healthy vegetation.
CONUS grids of latency-weighted NDVI are generated using a similar technique to the legacy MODIS-only SPoRT SST product. The current geographical extent of the CONUS grid ranges from 23°N to 55°N latitude and 130°W to 62°W longitude. The real-time data and increased resolution over the default monthly GVF climatology in community models result in an improved representation of vegetation in high-resolution models, especially in complex terrain and under anomalous weather and climate conditions.
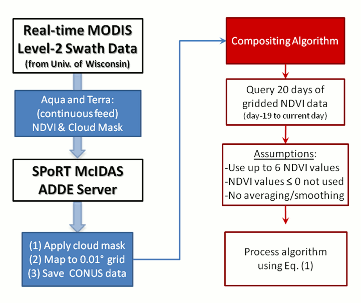
Figure 1 illustrates the data flow and processing that occurs during the course of creating a single daily NDVI composite. NDVI swath and cloud mask data are received from the University of Wisconsin, and each swath is individually mapped onto the CONUS 0.01° grid using McIDAS utilities (left column of Figure 1). A simple inverse time-weighting algorithm is applied to the remapped swath data (right column of Figure 1) that queries the previous 20 days for up to six pieces of NDVI data at each pixel to ensure a near-continuous grid.
The GVF is calculated from the MODIS NDVI composites on the identical 0.01° grid following the procedures outlined in Zeng et al. (2000) and Miller et al. (2006). For consistency with MODIS data, the International Geosphere-Biosphere Programme (IGBP) land-use classification (Loveland et al. 2000) as applied to the MODIS instrument (Friedl et al. 2010) is used in the GVF calculation. The GVF is computed at each grid point by first determining the maximum NDVI at each grid point (NDVImax) using the previous t NDVI composites, where t is ideally a large running collection of daily NDVI composites for at least a year. To determine the NDVImax values, the collection of daily NDVI composites from 1 June 2010 to 1 Feb 2012 is used for both archived and subsequent real-time GVF computations. Once found at each grid point, the NDVImax values are sorted as a function of the IGBP/MODIS land-use class. All grid points with the same land-use class are combined into a single distribution of NDVImax values, which are then sorted to identify the 90th percentile of NDVImax for each land-use class, and the 5th percentile for the barren land-use class. The GVF is then computed using the following formula

where NDVIi is the NDVI composite value at a grid point i, NDVIS is a global constant given by the 5th percentile of NDVImax for the barren land use class, and NDVIV,i is the 90th percentile of NDVImax values for the land use class at grid point i. As NDVI composites are collected over a longer time period, the NDVImax can be periodically updated to reflect subtle variations in the distributions of NDVImax by land-use classification.
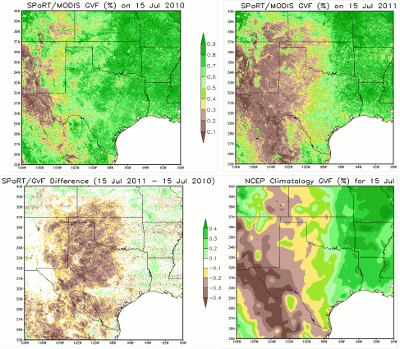
Figure 2 and Figure 3 show two examples of how the SPoRT-MODIS GVF product can vary substantially from the climatological depiction of GVF. In Figure 2, the SPoRT-MODIS GVF decreased dramatically over the Southern Plains from July 2010 to July 2011. During the early summer 2010, Texas and the Southern Plains enjoyed substantial early-summer rainfall that resulted in a vegetation fraction much higher than the climatological average for 15 July. However, extreme drought conditions prevailed during much of the late Spring and Summer of 2011 over the Southern Plains, which resulted in dramatically lower GVF in the real-time product and large year-over-year decreases down to -40% or less. This amount of inter-annual variability in GVF can result in significant mis-representations of the true vegetation health and coverage and corresponding heat flux partitioning in land surface and numerical weather prediction models, thereby leading to errors in simulated temperature, dewpoint, instability, and planetary boundary layer evolution.
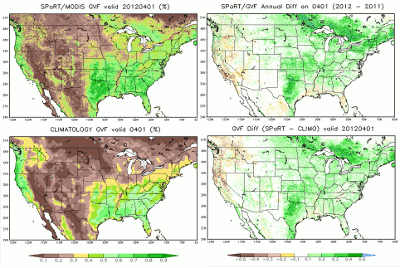
Another substantial deviation from climatology occurred in Spring 2012 during a dramatic early green-up across the eastern U.S. (Figure 3). The month of March 2012 experienced record warm temperatures across a large portion of the eastern U.S. and southeastern Canada. These unusually warm temperatures so early in the season invoked a response by the deciduous vegetation, which foliated much earlier than normal. By 1 April 2012, the real-time SPoRT-MODIS product revealed substantial positive departures in GVF up to 50% compared to the previous year (upper-right of Figure 3), and that of the climatology (bottom panels of Figure 3), especially over southeastern Canada. Anomalous temperature and/or moisture conditions can therefore lead to corresponding responses in the GVF, which cannot be accurately captured by a climatological GVF dataset. The use of a GVF climatology in such instances can lead to incorrect partitioning of heat fluxes and corresponding errors in low-level temperature and moisture fields.
SPoRT has conducted studies to illustrate the potential impact on real-time regional land surface and weather prediction models, including both the LIS and WRF models. In Case et al. (2012), the authors illustrated two severe weather events in which the real-time SPoRT-MODIS GVF led to a positive impact on the WRF-simulated precipitation. Also, the inclusion of the SPoRT-MODIS GVF in the real-time LIS leads to improvements in the partitioning of incoming shortwave radiation into sensible, latent, and ground heat fluxes, and ultimately improvements in the distribution of simulated soil moisture and soil temperature.
The SPoRT-MODIS GVF can be incorporated into real-time local and regional forecast models over the CONUS to replace the existing coarser-resolution GVF monthly climatology based on an outdated AVHRR satellite collection from 1985 to 1991. Instructions on how to incorporate the real-time SPoRT-MODIS GVF into the NOAA Science and Training Resource Center’s Environmental Modeling System (EMS, Rozumalski 2012) are available on the SPoRT Training web page.
References Cited
- Case. J. L., F. J. LaFontaine, S. V. Kumar, and C. D. Peters-Lidard, 2012: Using the NASA-Unified WRF to assess the impacts of real-time vegetation on simulations of severe weather. Preprints, 13th Annual WRF Users’ Workshop, P69. [available online]
- Case, J. L., F. J. LaFontaine, S. V. Kumar, and G. J. Jedlovec, 2011: A real-time MODIS vegetation composite for land surface models and short-term forecasting. Preprints, 15th Symp. on Integrated Observing and Assimilation Systems for the Atmosphere, Oceans and Land Surface, Seattle, WA, Amer. Meteor. Soc., 11.2. [available online]
- Friedl, M. A., D. Sulla-Menashe, B. Tan, A. Schneider, N. Ramankutty, A. Sibley, and X. Huang, 2010: MODIS Collection 5 global land cover: Algorithm refinements and characterization of new datasets. Remote Sens. Environ., 114, 168-182.
- Loveland, T. R., B. C. Reed, J. F. Brown, D. O. Ohlen, Z. Zhu, L. Yang, and J. W. Merchant, 2000: Development of a global land cover characteristics database and IGBP DISCover from 1 km AVHRR data. Int. J. Remote Sensing, 21, 1303-1330.
- Miller, J. M. Barlage, X. Zeng, H. Wei, K. Mitchell, and D. Tarpley, 2006: Sensitivity of the NCEP/Noah land surface model to the MODIS green vegetation fraction data set. Geophys. Res. Lett., 33, L13404, doi:10.1029/2006GL026636.
- Rozumalski, R. A., 2012: NEWR EMS User Guide. NOAA/NWS Forecast Decision Training Branch, COMET/UCAR. [available online]
- Zeng, X., R. E. Dickinson, A. Walker, M. Shaikh, R. S. DeFries, and J. Qi, 2000: Derivation and evaluation of global 1-km fractional vegetation cover data for land modeling. J. Appl. Meteor., 39, 826-839.


