

SPoRT-WRF
One challenge that forecasters face is applying convection-allowing numerical models to predict mesoscale convective weather. In order to address this specific forecast challenge, SPoRT produces real-time mesoscale model forecasts using the Weather Research and Forecasting (WRF) model that includes unique NASA products and capabilities. Currently, the SPoRT configuration of the WRF model (SPoRT-WRF) incorporates the 4-km Land Information System (LIS) land surface data, 1-km SPoRT sea surface temperature analysis and 1-km Moderate resolution Imaging Spectroradiometer (MODIS) greenness vegetation fraction (GVF) analysis, and retrieved thermodynamic profiles from the Atmospheric Infrared Sounder (AIRS). The LIS, SST, and GVF data are all integrated into the SPoRT-WRF through adjustments to the initial and boundary conditions, and the AIRS data are assimilated into a 9-hour SPoRT WRF forecast each day at 0900 UTC.
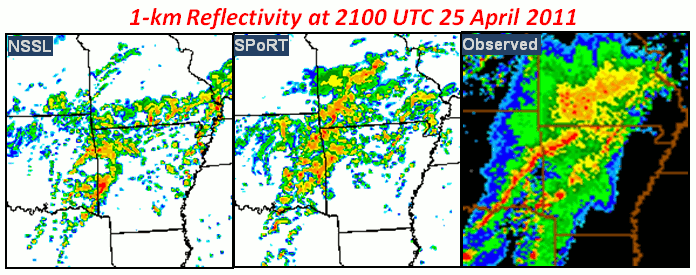
Figure 1. 1-km above ground level reflectivity for 21-hr forecast valid at 2100 UTC on 25 April 2011 of two convective thunderstorm squall lines in the central United States in the operational NSSL WRF (left) and experimental SPoRT-WRF (center) compared to observed radar reflectivity (right).
The SPoRT-WRF was evaluated internally for case studies from the April 25-27 historic tornado outbreak. An example of the performance of the SPoRT-WRF in detecting areas of convective precipitation is shown in Figure 1 with the SPoRT-WRF producing more convection in the proper location (compared to observed reflectivity) when evaluated against a control forecast from the operational National Severe Storms Laboratory (NSSL) WRF.
The SPoRT-WRF was evaluated at the 2011 Hazardous Weather Testbed (HWT) Experimental Forecast Program (EFP) as a deterministic model. The EFP brings together research and operational meteorologists to qualitatively evaluate different model forecasts for their ability to predict convection. Feedback from the EFP showed that the SPoRT-WRF was consistently too cool and dry and that for the most part it performed at a lower effectiveness compared to the NSSL WRF (Figure 2). Using this feedback, SPoRT researchers determined that the methodology of the assimilation of the AIRS profile data as a start and stop was likely the cause of this bias in the analysis and have devised a new strategy for version 2 of the SPoRT-WRF, which will be unveiled in early 2012.
Version 2 of the SPoRT-WRF will use a cycling methodology similar to that used at the National Centers for Environmental Prediction (NCEP)/Environmental Modeling Center (EMC) to incorporate multiple satellite and conventional observations as well as retrieved profiles from AIRS and the Infrared Atmospheric Sounding Interferometer (IASI) using the Gridpoint Statistical Interpolation (GSI) data assimilation system. In this cycling methodology, much more observational data can be assimilated in a smoother manner leading to less "shock to the system", which was determined as the likely cause of the cool, dry bias in version 1 of the SPoRT-WRF. Another upgrade to version 2 of the SPoRT-WRF is the incorporation of satellite-derived CMORPH hourly precipitation estimates from the Climate Prediction Center as the precipitation forcing for the LIS. This will allow for better estimates of precipitation over the western United States where radar and gauge data are limited. Also, version 2 of the SPoRT-WRF will use a USGS-generated MODIS vegetation product called eMODIS to produce a more formally evaluated greenness product over the SPoRT GVF product used in version 1. The version 2 forecasts will be disseminated in real-time to the HWT for evaluation in the 2012 EFP. Figure 3 is a schematic of the new daily 0000 UTC analysis and forecasting procedure.

Figure 2. Qualitative evaluation of the SPoRT-WRF at the 2011 HWT EFP.
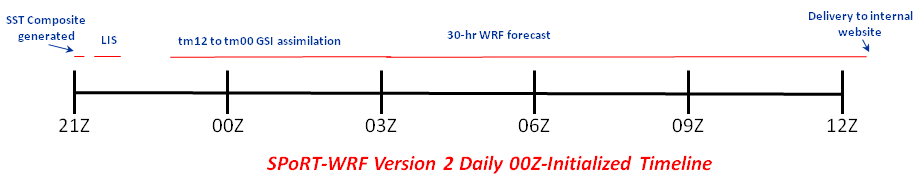
Figure 3. Planned daily 0000 UTC SPoRT-WRF timeline.